The Benefits of a KPI Dashboard for Business Performance Displayed on Screen
Having access to real-time data is crucial for making informed decisions and staying ahead of the competition. A Key Performance Indicator (KPI) dashboard is an essential tool for monitoring business performance and ensuring that strategic goals are met. This blog post explores the significant advantages of using a KPI dashboard, particularly when integrated with PowerBI across all hardware platforms. We’ll also discuss the role of AI in optimizing digital signage through insights into audience engagement and dwell time per content. Discover why implementing a KPI dashboard is crucial for maintaining a competitive edge and driving your business toward success in today’s fast-paced market.
Understanding KPI Dashboards
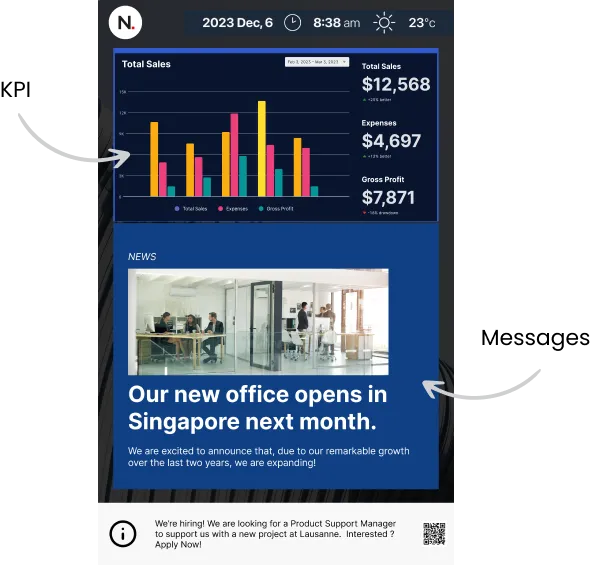
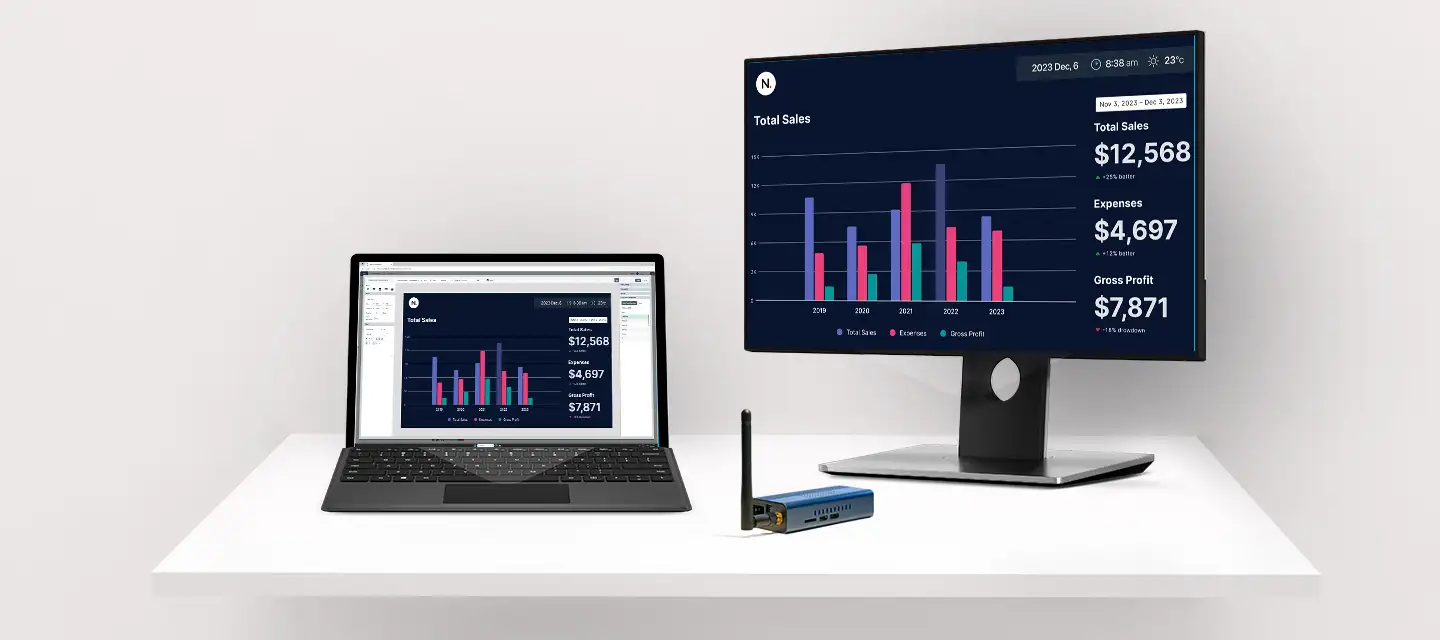
A KPI dashboard is a visual representation of key metrics that reflect the performance of an organization. It consolidates data from various sources into one accessible platform, providing a comprehensive view of critical business activities. KPI dashboards are designed to offer real-time insights, streamline decision-making processes, and help teams stay aligned with strategic objectives.
Why KPI Dashboards are Essential
- Real-Time Insights: One of the most significant benefits of KPI dashboards is the ability to provide real-time data. This allows businesses to respond quickly to changes in performance, identify trends as they emerge, and make adjustments promptly.
- Streamlined Decision-Making: With all essential metrics in one place, decision-makers can quickly assess the business’s current state and make informed decisions without having to sift through multiple reports.
- Enhanced Alignment: KPI dashboards display the same data, ensuring that all team members are on the same page. This alignment helps maintain focus on strategic goals and improve overall productivity.
- Trend Identification: Businesses can identify positive or negative trends early by regularly monitoring key metrics. This proactive approach enables companies to capitalize on opportunities and mitigate potential issues before they escalate.
- Increased Productivity: With immediate access to relevant data, teams can focus more on execution rather than data gathering and analysis. This boost in productivity translates to better performance and achievement of business goals.

Integrating PowerBI with KPI Dashboards
PowerBI, a powerful business analytics tool by Microsoft, enhances the functionality of KPI dashboards by providing robust data visualization capabilities and seamless integration across various hardware platforms. PowerBI ensures that critical data is always at your fingertips, whether accessed via desktops, tablets, or mobile devices.
Benefits of Using PowerBI for KPI Dashboards
- Comprehensive Data Visualization: PowerBI offers a wide range of visualization options that make it easy to understand complex data. Businesses can choose the best way to represent their metrics, from bar charts to heat maps.
- Cross-Platform Accessibility: PowerBI’s compatibility with multiple hardware platforms ensures you can access your KPI dashboard from anywhere, anytime. This flexibility is particularly beneficial for businesses with remote teams or multiple locations.
- Customizable Dashboards: PowerBI allows users to create customized dashboards tailored to their specific needs. This customization ensures that the most relevant metrics are always in focus.
- Interactive Reports: PowerBI’s interactive features enable users to drill down into data for deeper insights. This interactivity is crucial for understanding the underlying factors driving performance.
- Integration with Other Tools: PowerBI seamlessly integrates with various other business tools, such as Excel, SharePoint, and Dynamics 365. This integration ensures that all your data sources are connected and working together efficiently.
Leveraging AI for Digital Signage Optimization
Artificial Intelligence (AI) plays a pivotal role in optimizing digital signage by providing insights into which content is the most viewed and engaging. By analyzing audience behaviour and dwell time per content, AI can help businesses make more informed decisions about their digital signage strategies.
How AI Enhances Digital Signage
Content Performance Analysis: AI can analyze which pieces of content are the most engaging based on view counts and interaction rates. This analysis helps businesses understand what resonates with their audience.
- Audience Insights: AI provides valuable insights into audience behaviour by tracking metrics such as dwell time and engagement. These insights can be used to tailor content more effectively to meet the target audience’s preferences.
- Improved Efficiency: With AI-driven analytics, businesses can quickly identify underperforming content and replace it with more effective material. This continuous optimization leads to better overall digital signage performance.
- Personalized Experiences: AI can help create personalized experiences by displaying content that is relevant to the individual viewer. This personalization increases engagement and makes the content more impactful.
KPI Dashboard Examples
To illustrate the power of KPI dashboards, let’s explore a few examples of how different industries can utilize them:
Corporate Environment
In a corporate environment, KPI dashboards are indispensable tools for various departments to monitor and enhance performance. For executive leadership, dashboards display key metrics such as overall company revenue, profit margins, and strategic initiative progress, enabling informed decision-making and effective communication with stakeholders.
Sales departments benefit from tracking monthly performance, lead conversion rates, and pipeline health, which helps identify top performers and potential issues. Human resources can monitor employee turnover, satisfaction scores, and recruitment efficiency to improve workforce management. Marketing teams use dashboards to measure campaign ROI, website traffic, and lead generation, optimizing strategies and budget allocation.
Finance departments track cash flow, budget variance, and expense ratios, ensuring financial health and accurate forecasting. Customer service teams monitor satisfaction scores and response times to enhance service quality. By integrating these dashboards, corporations can ensure alignment with strategic goals and drive overall productivity and success.

Retail Industry
In retail, a KPI dashboard might track metrics such as sales per store, inventory levels, customer satisfaction scores, and online conversion rates. By consolidating this data, retail managers can quickly identify high-performing stores, optimize inventory management, and enhance the overall customer experience.
Healthcare Industry
For healthcare providers, a KPI dashboard could include metrics like patient wait times, bed occupancy rates, staff performance, and patient satisfaction scores. This information helps healthcare administrators improve operational efficiency, enhance patient care, and ensure compliance with industry standards.
Manufacturing Industry
In manufacturing, a KPI dashboard might display metrics such as production output, machine downtime, quality control statistics, and supply chain efficiency. By monitoring these metrics, manufacturers can identify bottlenecks, improve production processes, and reduce costs.

Implementing KPI Dashboards in Your Business
Implementing a KPI dashboard involves several key steps:
- Identify Key Metrics: Determine which metrics are most important for your business goals. These should be aligned with your strategic objectives and provide actionable insights.
- Choose the Right Tools: Select a dashboard software that meets your needs. PowerBI is an excellent choice due to its robust features and cross-platform compatibility.
- Integrate Data Sources: Ensure that all relevant data sources are connected to your dashboard. This integration might include CRM systems, financial software, and operational databases.
- Customize Your Dashboard: Tailor the dashboard to highlight your business’s most critical metrics. This customization ensures that you are focusing on what matters most.
- Train Your Team: Ensure all team members understand how to use the dashboard and interpret the data. This training ensures that everyone is aligned and can make informed decisions.
- Monitor and Adjust: Review your dashboard regularly and adjust the metrics as needed. This continuous monitoring ensures that your dashboard remains relevant and useful.
Future Trends in KPI Dashboards
As technology continues to evolve, the future of KPI dashboards looks increasingly promising. Emerging trends such as augmented analytics, predictive analytics, and real-time data streaming are set to revolutionize the way businesses interact with their data. Augmented analytics leverages AI and machine learning to automate data analysis, providing even deeper insights with minimal effort. Predictive analytics helps forecast future performance by analyzing historical data and identifying patterns. Real-time data streaming ensures that decision-makers have the most current information at their fingertips, enabling quicker and more effective responses to changing conditions. By staying ahead of these trends and incorporating them into your KPI dashboard strategy, you can further enhance your business’s agility, efficiency, and competitive edge in the market.
Final Thoughts on KPI Dashboards for Business Success
A KPI dashboard is an invaluable tool for monitoring business performance and ensuring that strategic goals are met. By integrating PowerBI, businesses can use comprehensive data visualization, cross-platform accessibility, and interactive features. Additionally, leveraging AI for digital signage optimization provides insights into content performance and audience behavior, leading to more effective and engaging digital signage strategies.
Implementing a well-designed KPI dashboard is crucial for maintaining a competitive edge and driving your business toward success. By following the steps outlined above, you can create a powerful tool that provides real-time insights, streamlines decision-making and enhances overall productivity. Embrace the power of KPI dashboards and take your business performance to the next level.

